
Reading a balance sheet alongside cash flow
Reading a Balance Sheet Alongside Cash Flow: Our Guide to Seeing the Full Picture
We remember staring at the screen in 2018, watching a major UK construction firm’s share price evaporate. The company had reported a respectable profit just months earlier, yet here it was, drowning in debt and unable to pay its bills. That moment cemented a rule in our team’s mind: we never trust a profit figure in isolation. A company can be profitable on an income statement and still go completely bust. To truly understand a business, we need the balance sheet and the cash flow statement working together, revealing the story behind the earnings.
Why Our Team Refuses to Look at Profit in Isolation
Net income grabs headlines, but it rarely tells the full truth. The income statement operates on accrual accounting, matching revenues to expenses regardless of when cash actually changes hands. We have seen too many investors fall in love with a growing earnings number, only to miss the fact that the business is bleeding cash. This narrow focus is a classic trap, and understanding the limitations of the income statement is the first step toward genuine financial literacy.
The Accrual Illusion: When Profit Isn’t Cash
Accrual accounting allows companies to book revenue when a sale is made, not when the invoice is paid. We have analysed manufacturers that ship products in December, record the profit, and yet won’t see the cash until March. On paper, the year looks brilliant. In reality, the bank account is empty. This illusion is why we always pull up the balance sheet and cash flow statement immediately after reviewing earnings. The income statement is the headline; the other two statements are the fine print that stops us from making a catastrophic allocation of capital.
Investor Psychology: Anchoring on Earnings Per Share
Our team has studied market history long enough to recognise the psychological trap known as anchoring bias. Investors latch onto a single data point—usually Earnings Per Share (EPS)—and judge all subsequent information against that anchor. When a company beats EPS estimates, euphoria takes over, and nobody asks whether the cash flow supports the number. We actively fight this bias by forcing ourselves to start our analysis with liquidity and cash generation, not profit. By shifting the anchor from EPS to free cash flow, we avoid getting swept up in the narrative spun by accrual accounting.
The Balance Sheet: A Snapshot of Resilience
We view the balance sheet as a company’s suit of armour. When markets crash, income statements quickly turn ugly, but a fortress balance sheet allows a business to survive and even thrive. We look for companies that can pay their bills tomorrow, not just those that reported a profit yesterday. The resilience of the FTSE 100 during the 2008 financial crisis offers a perfect lesson here: companies with bloated debt loads collapsed, while those with strong current asset positions lived to see the recovery.
Liquidity and Solvency: Checking the Quick Ratio
To measure resilience, we reach for the quick ratio. This strips out inventory from current assets and divides the remainder by current liabilities. We prefer a ratio above 1.0, meaning the company can cover its immediate obligations without having to sell a single item of stock. It is a brutal, honest metric. During market history’s most famous crashes, from 1929 to 2008, businesses that relied on selling slow-moving inventory to pay creditors were the first to fail. The quick ratio cuts through that risk instantly.
The Debt-to-Equity Warning Sign We Never Ignore
If the quick ratio tells us about survival this quarter, the debt-to-equity ratio tells us about survival over the long term. We calculate this by dividing total liabilities by shareholders’ equity. A ratio north of 2.0 often signals that a company has been feasting on cheap credit, leaving it dangerously over-leveraged. When economic tides recede, that debt becomes a noose. We have seen it time and again: a firm with a high debt-to-equity ratio might look efficient during a bull market, but it accelerates the panic when asset values start to drop.
The Cash Flow Statement: The Ultimate Reality Check
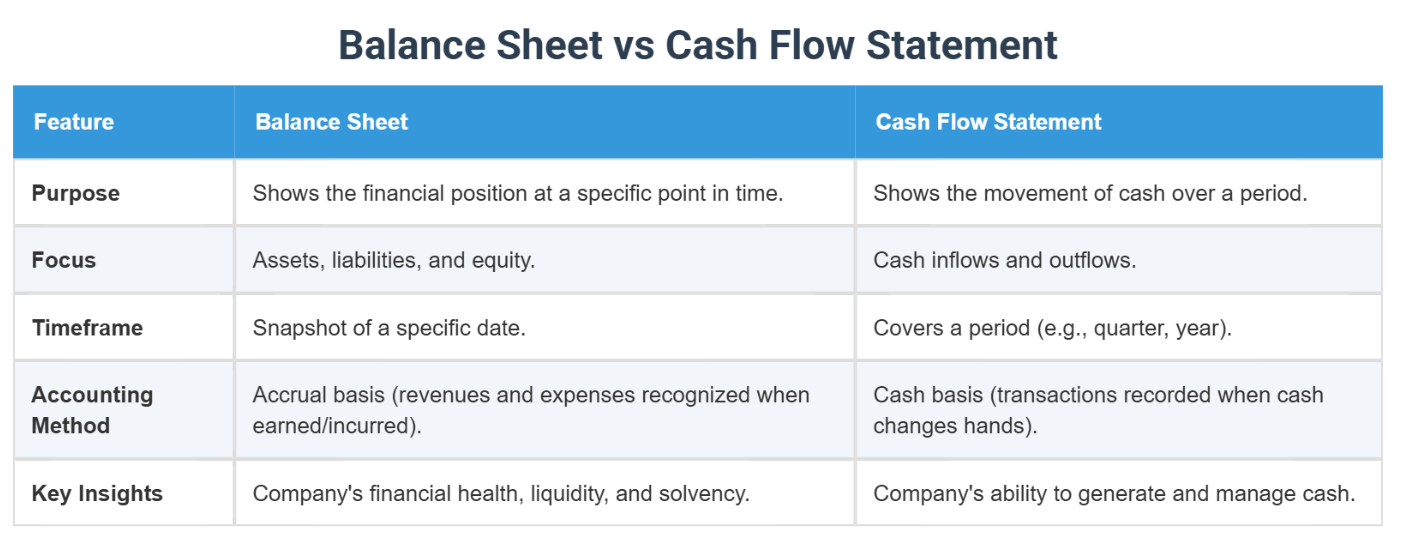
If the balance sheet is a photograph, the cash flow statement is a film. It tracks the actual movement of cash through the business, separated into operations, investing, and financing. We have often looked at a static balance sheet that showed a healthy cash balance, only to discover from the cash flow statement that the cash came from a massive emergency loan, not from selling products. The cash flow statement strips away all accounting assumptions and shows us exactly how the company is surviving.
Operating Cash Flow: The Engine of the Business
We focus relentlessly on operating cash flow. This section adjusts net income for non-cash charges and changes in working capital. It answers a simple question: does the core business generate cash, or does it consume it? We want to see a positive, growing figure here. A company can report a rising net income, but if operating cash flow is consistently negative, the business is funding its operations through debt or share issuance, a path that leads directly to the kind of collapses we study in market history.
Free Cash Flow: What’s Left for Shareholders After Survival
Once a company pays for its factories, equipment, and maintenance—the capital expenditures—whatever remains is free cash flow. This is the cash truly available to pay dividends, buy back shares, or reduce debt. We consider free cash flow the ultimate measure of financial literacy. It tells us whether a company is a self-sustaining entity or a machine that constantly needs fresh fuel. When we see a firm reporting record profits but negative free cash flow, we know the reported profit is an illusion.
Connecting the Dots: Where the Statements Meet
Understanding each statement in isolation is not enough. The magic of financial analysis happens when we trace a single business event through all three documents. The link between the balance sheet and the cash flow statement is particularly revealing, often exposing hidden trouble or quiet efficiency that the income statement completely ignores.
Depreciation: The Non-Cash Charge That Confuses Beginners
Depreciation is one of the simplest yet most misunderstood links between the statements. On the income statement, it reduces profit. On the cash flow statement, we add it back to operating cash flow because no cash actually left the business. Meanwhile, on the balance sheet, accumulated depreciation reduces the value of fixed assets. We often see novice investors panic when a capital-intensive company reports low net income due to heavy depreciation, missing the fact that the business is actually generating huge amounts of cash.
Working Capital Swings: A Red Flag in Retail Stocks
We pay particularly close attention to inventory movements. If inventory on the balance sheet rises much faster than sales, it signals that products are piling up unsold. On the cash flow statement, this shows up as a negative adjustment to operating cash flow—cash has gone out the door to build products that haven’t brought any cash back in. We have spotted this red flag early in numerous UK retail stocks, where a glossy income statement hid the reality of warehouses stuffed with unsold seasonal goods.
Spotting the Red Flags Before a Famous Crash
The ultimate test of our combined analysis is whether it can help us avoid permanent capital loss. UK market history provides a textbook case study in the collapse of Carillion in 2018. We have dissected this failure repeatedly, and it always reinforces why we must read the balance sheet and cash flow statement side by side.
The Carillion Case: Profitable on Paper, Bankrupt in Reality
The collapse of Carillion in the UK in 2018 stands as a brutal monument to the failure of isolated profit analysis. The construction giant reported pre-tax profits, paid dividends, and held a portfolio of prestigious government contracts. Yet our team’s method would have spotted the rot years earlier. Carillion’s balance sheet was loaded with goodwill and intangible assets—fluffy numbers that could not pay a supplier. More critically, its operating cash flow was a disaster. While the income statement showed profit, the cash flow statement revealed a business that was haemorrhaging cash from operations, constantly borrowing just to keep the lights on. When the credit tap turned off, the company had no armour. The balance sheet looked solid only to those who ignored the quality of the assets and the negative cash conversion.
How Over-Leveraged Balance Sheets Accelerate Market Panics
We have observed that during famous market crashes, it is rarely the profit decline that kills a company; it is the balance sheet. When asset prices fall, over-leveraged firms face margin calls and covenant breaches. They are forced to sell assets into a falling market, accelerating the downward spiral. The FTSE 100’s performance during the 2008 financial crisis illustrated this perfectly. Banks and property firms with thin equity cushions were nationalised or collapsed entirely, while cash-rich companies with low debt-to-equity ratios not only survived but acquired distressed competitors at bargain prices. The psychology of panic feeds on leverage; a company with a clean balance sheet removes that fear from the equation.
Conclusion
Combining the balance sheet and the cash flow statement is not just an academic exercise; it is our primary defence against the psychological traps of market euphoria. Anchoring bias makes us cling to profit, but true financial literacy lies in tracing the cash. By checking the quick ratio, monitoring operating cash flow, and understanding the lessons from Carillion and the 2008 financial crisis, we give ourselves the full picture. Markets will always be emotional, but our portfolio decisions do not have to be. We sleep better at night knowing we own businesses that generate real cash, not just accounting illusions.
FAQ
Why can’t we just look at net profit to judge a company?
Net profit includes non-cash items like depreciation and can be manipulated by aggressive revenue recognition. A company can show a profit and still go bankrupt if it lacks the cash to pay its debts, which is why we always check the cash flow statement.
What is the single most important line on the cash flow statement?
We focus on operating cash flow. It shows the cash generated by the actual business activities, stripped of financing tricks and one-off asset sales. If this number is negative while profits are positive, it is a major red flag.
How does the quick ratio differ from the current ratio?
The quick ratio removes inventory from current assets. We prefer it because inventory can be difficult to liquidate quickly during a crisis. It gives us a more honest view of a company’s ability to pay its immediate bills.
What lessons did the 2008 financial crisis teach about balance sheets?
The FTSE 100’s performance during the 2008 crisis showed that over-leveraged firms with high debt-to-equity ratios collapsed first. Companies with strong cash reserves and low debt had the resilience to survive the crash and capitalise on the recovery.
How did Carillion collapse despite having government contracts?
The collapse of Carillion in the UK in 2018 happened because its balance sheet was filled with low-quality intangible assets, and its operating cash flow was consistently negative. The reported profits were an accounting construct that never materialised into the cash needed to run the business.